
Evidence before the decision.
International market comparison
Compare 2–6 countries on the same six indicators before you commit a market-entry budget. Source and observation year next to every number. Report, workbook and decision brief the same day.
View sample and order · 149 € ↗
Markets in numbers,
before the first trip.
International market comparison
2–6 countries. Population, GDP per capita, growth, internet use, urbanisation and trade with observation years. PDF, workbook, CSV, decision brief and offline tool.
GDP per capita · Sweden
Unemployment · Germany
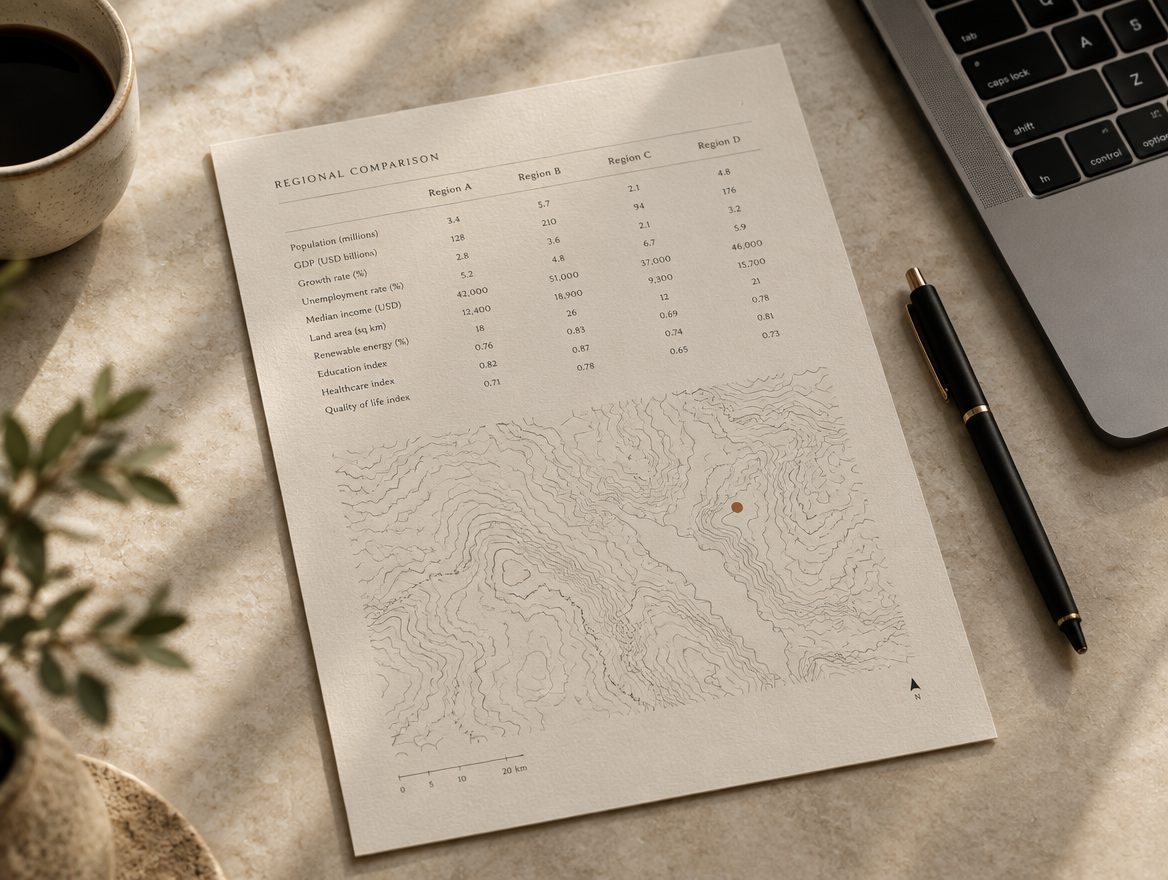
Real sample · each observation keeps its own year
| Country | GDP per capita | Unemployment | Renewable electricity | |
|---|---|---|---|---|
| Finland | 56,149 USD | 9.5 % | 52.9 % | |
| Sweden | 63,133 USD | 8.7 % | 67.4 % | |
| Germany | 60,496 USD | 3.7 % | 39.8 % |
World Bank, World Development Indicators · retrieved 2026-09-07. Your report is built for the countries you choose.
“Three candidate markets, one afternoon. The shortlist was made on sourced numbers, not on gut feeling.”
Export adviser, Helsinki · sample use case
Renewable electricity · Sweden
Countries per report
Not included, verify yourself
Sector demand, distributor terms, regulation and pricing. Stated in the report, not in small print.
Built for a decision,
not for browsing.
Export team
A sourced shortlist and the list of things to verify before you spend on a distributor search.
Market-entry consultant
Sources included. No spreadsheet work.
Recruitment and sourcing
Country by country, comparably.
Start from the decision
you need to make.
Find buyers and tenders
Where the next contract comes from: public tenders, awarded contracts and new Finnish companies.
Choose an export market
Countries and regions on the same official indicators before you commit to a market.
Check a company or supplier
Identity, registers and sanctions-list checks before a contract or first payment.
Find projects and funding
Where building happens and where the money comes from.
Finland: location and property
Postcode-level numbers for a Finnish shop, office or apartment.
Hospitality and property
research, worldwide.
Ready products for hotel owners, procurement and design teams, with an Asia focus. Sold on Raslak Atlas, delivered under the Nobiqo & Co. brand.
Ready product
Prepare comparable enquiries for suitable hospitality suppliers.
€79Ready product
Match a material to the right care instruction before treatment.
€59Ready product
Close the document gaps that block an asset handover.
€129Quotation service
Resolve quotation gaps before choosing an FF&E offer.
€990Research edition
Choose the next luxury-property account to qualify.
€129Research edition
Turn disruption planning into assigned, testable actions.
€129Three steps,
no meetings.
Choose the scope. 2–6 countries. Sample and data limits are shown before payment.
Pay with Stripe. One-time price plus applicable tax. Invoice by email.
Download. PDF, workbook, CSV, decision brief and offline tool from your private delivery page.
Where the data comes from,
and what it does not say.
Sources
Every number comes from public statistics, with the source and observation year beside it.
Data limits
These reports provide context, not a sales forecast, supplier rating or legal opinion. Observations can be several years old. You pay for selection, comparison and delivery; the source data is public.
Need the work done, not just the data?
Scoped expert services at a fixed price. Scope and price are confirmed in writing before work starts.
See the services ↗- Hub Process ProjectOne working chain from request for quote to work order and invoicing data.€2,500 excl. VAT
- Site Documentation and MaintenanceEquipment, warranties and maintenance instructions in one place when you need them.€790 setup
+ €79 / month excl. VAT - Raslak Atlas under your brandSourced research on your client’s question, under your name.€1,200 per delivery excl. VAT